

San Francisco Car Break-Ins Analyzed
As strategic city drivers often ask themselves, “How much safer will my car be here, compared to a block (or a BART ride) away?”
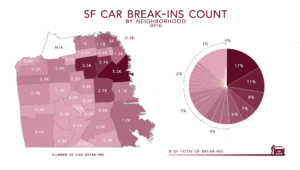
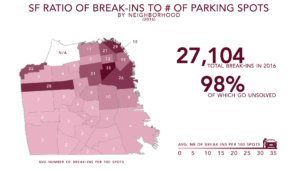
If we just look at the raw number of car break-ins, your car is worst-off in SOMA/South Beach/Mission Bay. 17% of the car break-ins in 2016 were there. But according to our analysis, the area of SF with the highest ratio of break-ins to available parking spots is Downtown/Civic Center/Tenderloin.
At SpotAngels we map and count all the street parking spots in the cities we cover, including in San Francisco. We know that compared to other regions SOMA/South Beach/Mission Bay also has a lot of parking spots: 1.85 times the city average. This means it might have so many break-ins just because there’s so much more parking there.
But if we calculate the annual rate of break-ins per parking spot in each of these neighborhoods, we can correct for neighborhood size. When we do, we find that Downtown/Civic Center/Tenderloin tops the list, with .35 break-ins per parking spot.

If you drive, live, or work in any of the neighborhoods at the top of this list: watch out. For every 100 parking spots in Downtown/Civic Center/Tenderloin, North Beach/Telegraph Hill, Golden Gate Park, or SOMA/South Beach/Mission Bay, there were over 25 break-ins. And while some of the usual suspects (like Downtown/Civic Center/Tenderloin) rank high on this list, so do a lot of areas with high income residents, and high rent.

Rent data source: Zumper
The big take away here is that, even in a posh zip code, you shouldn’t leave valuables visible in your car. It actually seems like higher rent correlates to a higher ratio of break-ins to parking spots, probably because both the break-in ratio and rent prices are influenced by how accessible a neighborhood is, and how central it is to the city.
Wherever you live, you’ll want to avoid parking on the highest-risk blocks in your neighborhood, especially through the highest-risk time periods.
Worst Blocks in San Francisco for Car Break-Ins
500 John F. Kennedy Drive is the worst block for car break-ins in San Francisco. 33% of the break-ins in Golden Gate Park in 2016 occurred on this block. In addition to the 10 worst blocks in San Francisco, we’ve also listed the worst blocks in the remaining high break-in ratio neighborhoods: North Beach/Telegraph Hill, Russian Hill, Chinatown, the Financial District and Nob Hill.

Not Just Your Imagination: Break-ins Were Up in 2017
The thing that makes parking in San Francisco trickiest is that it’s never the same day to day, or year to year. And last year was a big year for car break-ins in San Francisco. 
There were 28,701 break-ins Jan-October of 2017, compared to 24,021 over the same period of 2016. That’s a difference of over 19%. The increase in break-ins, in August, SFPD dissolved the unit investigating the increase in favor of dispatching more, hopefully deterrent, foot patrols.
SpotAngels is an app that helps you find safe places to park and avoid tickets. We blog about our parking-related research, including about tickets and break-ins. Try the free SpotAngels app available on the Apple App Store and the Google Play Store.
38 Comments
The point about high-rent areas still having a high break-in ratio per spot is really insightful. It completely shatters the assumption that wealthier neighborhoods are automatically safer for parking. That .35 break-ins per spot in Downtown is a stark number to remember.
Stumbled on this by accident but glad I did. Fills a gap in most of the other content out there on the subject.
Thank youuu!
Sharing this with a colleague who’s been asking about exactly this. Clear enough to forward without extra context.
The point about at SpotAngels we map and count all the street parking spots in the cities we cover, including in added useful context to The Worst Parking Spots in SF for Car Break-Ins. AI Couple may also be useful to readers comparing AI couple photo generator; its focus is to make complex photo edits simple with AI — no design experience needed.
The comparison between raw break-in totals and break-ins per parking spot is especially insightful—SOMA’s large parking supply really changes the picture. A visual workspace like Reference2Video could turn these neighborhood rankings, risk ratios, and time trends into clear map-based videos that make the findings easier to understand and share.
reference to video
The correlation between higher rent and higher break-in ratios per parking spot is a fascinating insight — it makes sense that centrality drives both. Also striking that 500 John F. Kennedy Drive alone accounted for 33% of Golden Gate Park’s 2016 break-ins.
The comparison between raw break-in totals and the rate per parking spot is especially useful—SOMA’s 17% share looks different once you account for how much parking it has. The warning about valuables is a good reminder wherever you park. For sharing a quick neighborhood safety tip, a distinctive text style can help it stand out.
fonts copy and paste
This is a good breakdown of the actual risks. It’s frustrating how unpredictable car break-ins can be, even in seemingly nice areas. I’ve definitely had to be more careful since I started using ChoicerVoicer.games to find better parking options.
The breakdown by break-ins per parking spot is especially useful—raw totals alone make SOMA look worst, while Downtown/Civic Center/Tenderloin has the higher rate. The reminder not to leave valuables visible is timely. For a playful video afterward, Money Spread AI can turn a character photo into a 16-second cash-fan performance with its original s
Money Spread AI
This is wild, I always thought it was just random but the data on parking spots makes sense. I’ve been trying to find better parking options for my commute and was looking at some tools on Flying Car AI recently. Definitely makes you think twice about where you leave your car.
The breakdown of risk by location is a useful reminder that visual context matters. I’ve been exploring a video prompt generator for turning reference footage into structured scenes and camera notes.
Need to leave parking stickers on the windows
had to translate with FreeDict dictionary
Reading this makes me so paranoid about leaving anything in my backseat whenever I head into the city. It’s wild how even the “posh” areas aren’t really safer. I actually wrote about the stress of navigating high-pressure environments over at First Person Boxing, and honestly, finding a safe parking spot in SF feels just as intense as a real match. Stay safe out there!
The distinction between raw totals and break-ins per parking spot is important—SOMA’s 17% share looks different once its unusually large parking supply is considered. Clear, high-resolution map graphics would make those neighborhood comparisons easier to inspect; https://aiimageupscaler.pro/ could help preserve detail when enlarging screenshots, though that feels somewhat secondary to the article’s safety findings.
I had no idea rent prices correlated with break-in rates, that’s such a weird but logical connection. I used to park near GGP all the time and never thought twice about it. Someone on crazy cattle 3d unblocked mentioned something similar about high-traffic areas being targets. Definitely clearing my car out from now on.
Mapping the ratio of break-ins to available parking spots is a smarter way to present this than raw incident counts, because a block with ten spaces and two break-ins is a very different risk than a lot with a hundred spaces and the same two. The Downtown/Civic Center/Tenderloin result matches what I hear from people who park there daily – the problem is less the neighborhood than the lack of attended garages. Curious whether the 2025 data still shows the same ranking after the recent enforcement changes.
Off-topic, but I keep a kaomoji copy and paste page bookmarked for the running commentary I post when I finally find a spot. A small text face does more for the tone than an emoji when you are writing about parallel parking. (。•́﹇•̀。)
The distinction between SOMA’s raw 17% share of break-ins and Downtown/Civic Center/Tenderloin’s 0.35 break-ins per parking spot is a useful reminder that neighborhood size changes the picture. The 33% concentration on 500 John F. Kennedy Drive also suggests that block-level patterns matter as much as citywide rankings. https://flux2max.app/
The finding that Downtown/Civic Center/Tenderloin has the highest break-ins per parking spot, even though SOMA has more raw incidents, is a useful correction to how most people read crime maps. I also appreciated the point that high-rent neighborhoods aren’t automatically safer, which undercuts the instinct to assume a posh zip code protects your car. The advice to avoid the worst blocks during peak-risk hours is practical, and it reminds me that parking strategy matters as much as location. For anyone who enjoys a quick distraction between errands, soflo wheelie life offers a light browser game, though the article’s warning about visible valuables is the takeaway worth remembering.
Using parking spaces as the denominator changes the interpretation of the break-in totals substantially. It would be helpful to show the observation period beside each map so readers can distinguish this historical comparison from current parking conditions.
The distinction between raw break-in totals and the rate per parking spot is a really helpful way to look at the data, especially seeing how SOMA compares to Downtown. It reminds me of how rhythm patterns need proper context rather than just raw count when building beats on https://beatmaker.studio/.
Manga panels deserve better than flat scans – the “The Worst Parking Spots in SF for Car Break-Ins” discussion here matches what I ended up settling on after weeks of testing. Great writeup for fellow hobbyists! AI manga colorizer
The breakdown showing that 500 John F. Kennedy Drive accounts for 33% of Golden Gate Park break-ins is a striking detail. When planning routes or testing random security variables for a trip, having specific block-level data like this is https://randomgenerator.one/ invaluable.
The distinction between SOMA’s 17% share of raw break-ins and Downtown/Civic Center/Tenderloin’s 0.35 break-ins per parking spot is a useful reminder to normalize crime data by exposure. A reference-grounded infographic made with https://nano-banana-2.me/ could show both measures side by side without implying that wealthier neighborhoods are safer.
The finding that Downtown/Civic Center/Tenderloin has the highest break-in ratio per parking spot, at .35, is a useful correction to the raw SOMA numbers, and the point about high-rent neighborhoods ranking high is genuinely counterintuitive. The detail that 33% of Golden Gate Park break-ins in 2016 happened on a single block, 500 John F. Kennedy Drive, makes the block-level list feel practical rather than abstract. The 19% jump between 2016 and 2017 is sobering, and it reinforces the advice to keep valuables out of sight no matter the zip code. For a quick break from parking stress, stunt bike extreme offers a stunt motorbike game.
The finding that Downtown/Civic Center/Tenderloin has the highest break-in ratio per parking spot, rather than SOMA, is a useful correction to the raw-count view, and the point about high-rent neighborhoods correlating with higher ratios is counterintuitive but well explained. The detail that 500 John F. Kennedy Drive accounted for 33% of Golden Gate Park break-ins in 2016 makes the block-level data feel concrete. It’s a reminder that safe parking is as much about location within a neighborhood as the neighborhood itself, much like picking a careful route in scooby doo run where timing and positioning decide survival.
The contrast between SOMA’s 17% share of break-ins and Downtown/Civic Center/Tenderloin’s .35 break-ins per parking spot would translate well into a short visual data explainer; https://pictetus.com/ could help present those map comparisons clearly. The 33% concentration on 500 John F. Kennedy Drive also shows why block-level context matters.
The contrast between SOMA’s 17% share of break-ins and Downtown/Civic Center/Tenderloin’s 0.35 break-ins per parking spot shows why both raw totals and normalized rates matter. A paired chart made with https://chart-maker.org/ could make that difference immediately clear while also showing the 2016-to-2017 increase.
The contrast between SOMA’s 17% share of break-ins and Downtown/Civic Center/Tenderloin’s 0.35 break-ins per parking spot shows why both raw totals and normalized rates matter. For readers comparing the neighborhood maps or charts side by side, https://combineimages.org/ could be useful for assembling those visuals into one image for easier reference.
Putting North Beach/Telegraph Hill and Golden Gate Park in the same over-25-break-ins-per-100-spots tier as Downtown/Civic Center/Tenderloin is what makes this resist a simple “skip downtown” rule of thumb. A park and a nightlife district landing beside the usual suspect suggests the per-spot rate is picking up how parking is distributed, not just neighborhood reputation. That reads as a reason to check the specific block rather than the district label. From the team behind Zombie Couple Video.
Normalizing by parking spots is the part that makes this useful. Raw counts put SOMA on top with 17% of break-ins, but with 1.85 times the city average in spots, Downtown/Civic Center/Tenderloin at .35 per spot is the real worst. Our neighborhood group made “leave nothing visible” flyers for each block on that list, and the illustrations came from a bulk AI image generator so every block got its own version.
Wow, the rent correlation is not something I would’ve guessed—makes sense though that central, busy areas attract both high rent and more break-ins. I used to park near Golden Gate Park all the time and never thought twice about it. I was browsing outstanding tiny desk ai last week and this reminds me I should really stop leaving stuff visible in my car.
Living near Civic Center, I’m not surprised that ratio tops the list—it always felt sketchy leaving anything in the car around there. The rent correlation is an interesting angle I hadn’t considered before. I once compared notes on city safety and noise in a forum thread on Background Noise Remover, and it’s wild how much perception changes block by block.
Turning .35 break-ins per spot into more than 25 per 100 spaces is what makes the ranking legible, and both figures are annual, so they describe a spot over a year rather than a single visit. That distinction matters when the list gets used to pick a block for a two-hour errand instead of to judge an entire district. Commenting as the team behind Rumpelstiltskin AI.
This breakdown of break-in ratios per parking spot is a smart way to look at risk, especially the point that high-rent areas aren’t automatically safer. It’s a good reminder that visibility of valuables matters more than zip code. Just as parking safety comes down to awareness of your surroundings, figuring out what you’re drawn to is also about noticing patterns. I tried MyType fyi recently and it was surprisingly accurate at revealing the features and styles I gravitate toward, all without uploading photos or signing up. For anyone 18+ curious about their type in looks, it’s a fun, private way to find out and share the result.
thanks for sharing
Living in SF, this hits close to home. I’ve had my window smashed near Golden Gate Park, and honestly I’ve gotten lazy about leaving stuff visible. Reading this makes me rethink my parking habits, especially since I often just grab the first spot I see. I was actually listening to a podcast about street safety while browsing this on free vocal remover, funny timing.